Cube86
← All work

Data & Reporting · Charities & Foundations

A community foundation cut quarterly reporting from two days to twenty minutes

A small community foundation in south London was spending two full days every quarter pulling grant data into a trustee report by hand. Their primary funder had just started asking for monthly data — a cadence the old process couldn't sustain. We built a live dashboard connected directly to their Google Sheet: always current, always ready, with the funder's monthly report one click away.

2 days → 20 min
Quarterly reporting time
< 60 sec
Pipeline latency
$0 / mo
Cost to run

The Problem

Two days of manual work, every quarter

All 40+ active grants lived in an 18-tab Google Sheet, inconsistently updated across two staff members and a part-timer. Every quarter, the Finance Manager spent two full days pulling the numbers — disbursed to date, status breakdowns, spend by category — into a Word document for the trustee board, then a separate spreadsheet for their primary funder.

Three trustees had independently asked whether they could just see the data live. The funder's new requirement for monthly data made the answer urgent. The existing process couldn't run monthly without consuming most of one person's working week.

Before

  • Two full days of manual work per quarterly trustee report
  • Trustees blind between reports — no way to check current figures
  • Primary funder now asking for monthly data the existing process couldn't sustain
  • Grant data spread across 18 tabs, inconsistently maintained

The Solution

A live link — always current, always ready

We built a password-protected live dashboard — a single shareable link that connects directly to their Google Sheet through a lightweight n8n integration. Every time a trustee or the funder opens it, they see data that is never more than 60 seconds stale. No login accounts to manage, no spreadsheet to share, nothing to export manually.

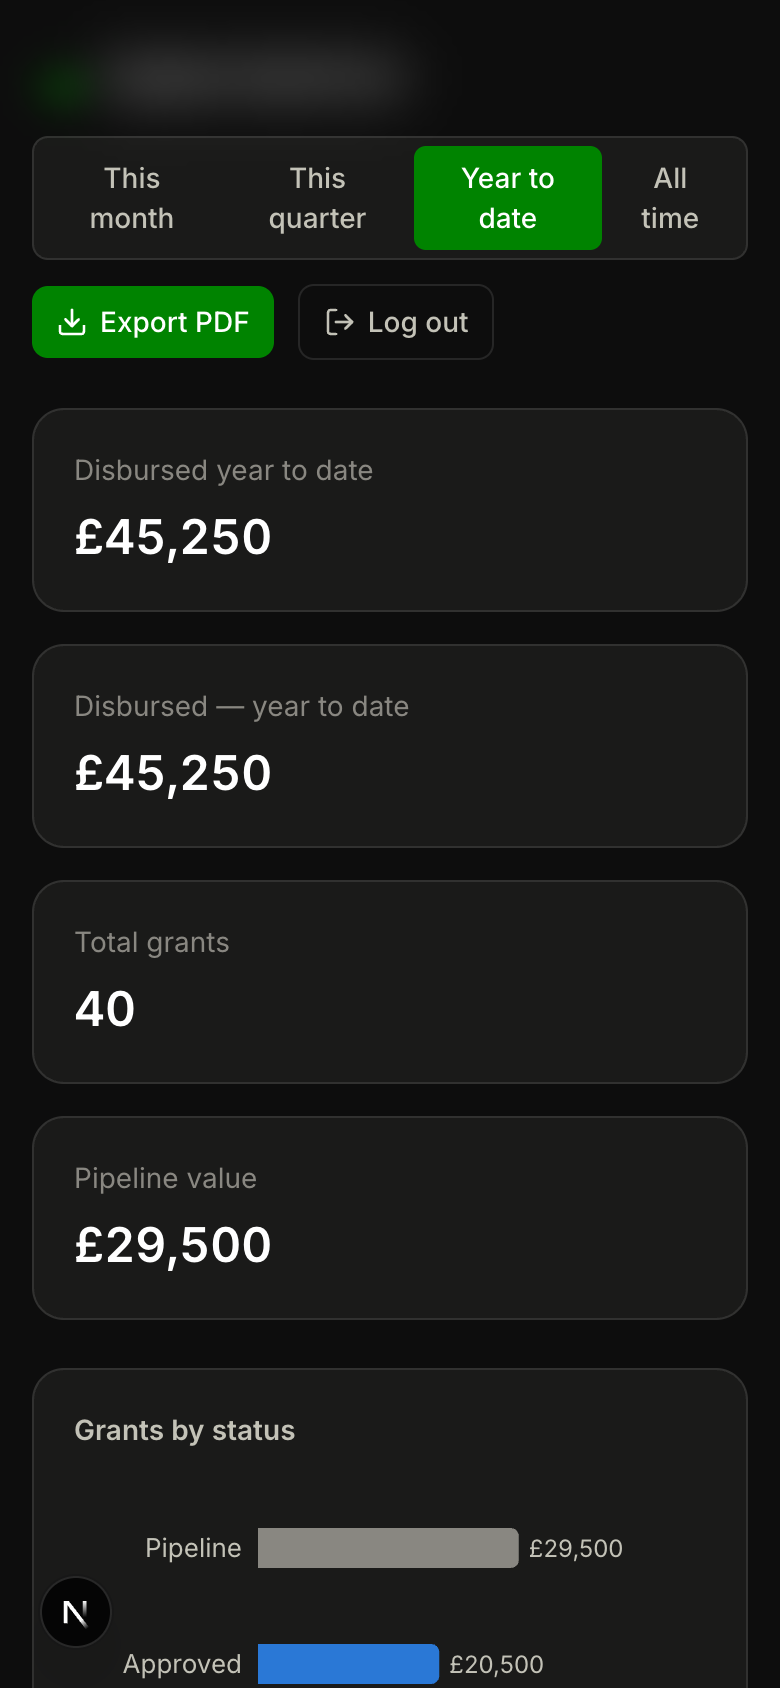
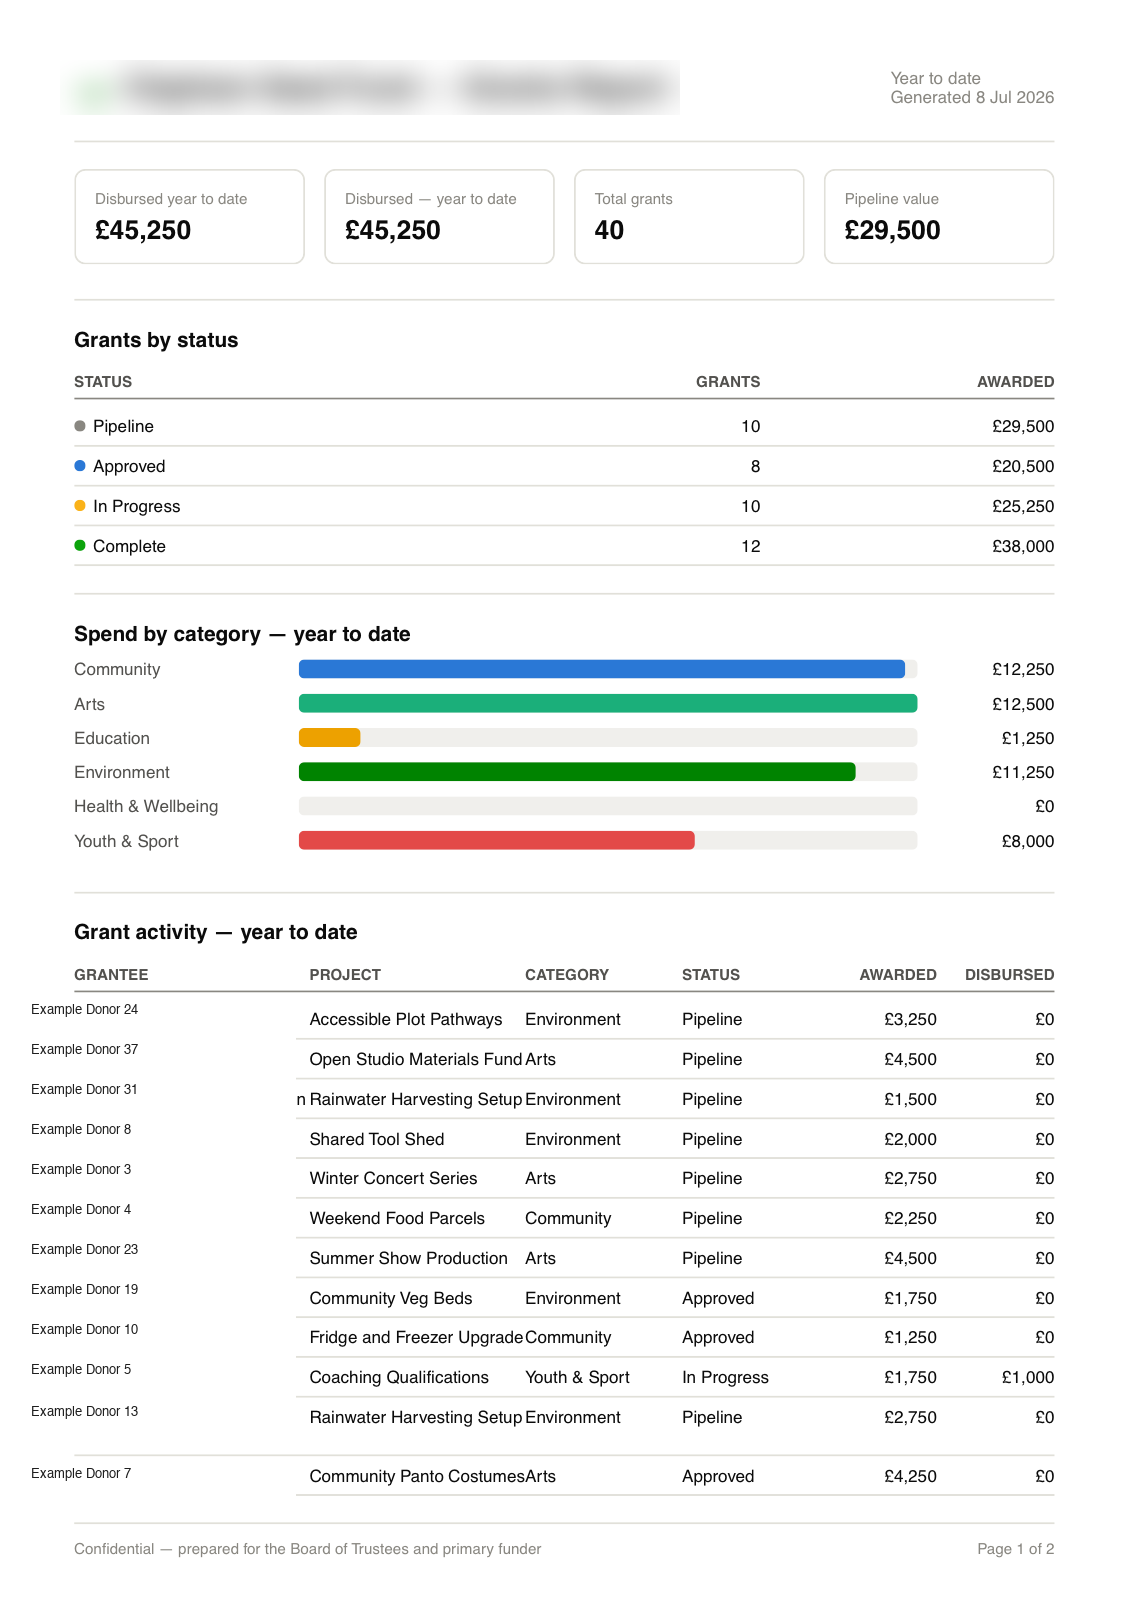
The period filter — This month, This quarter, Year to date, All time — was the direct answer to the monthly funder request: switch the filter, every number and chart on the page rescopes instantly. One click on Export PDF generates a print-ready report matching exactly what's on screen, branded and dated, ready to forward.

Live data pipeline

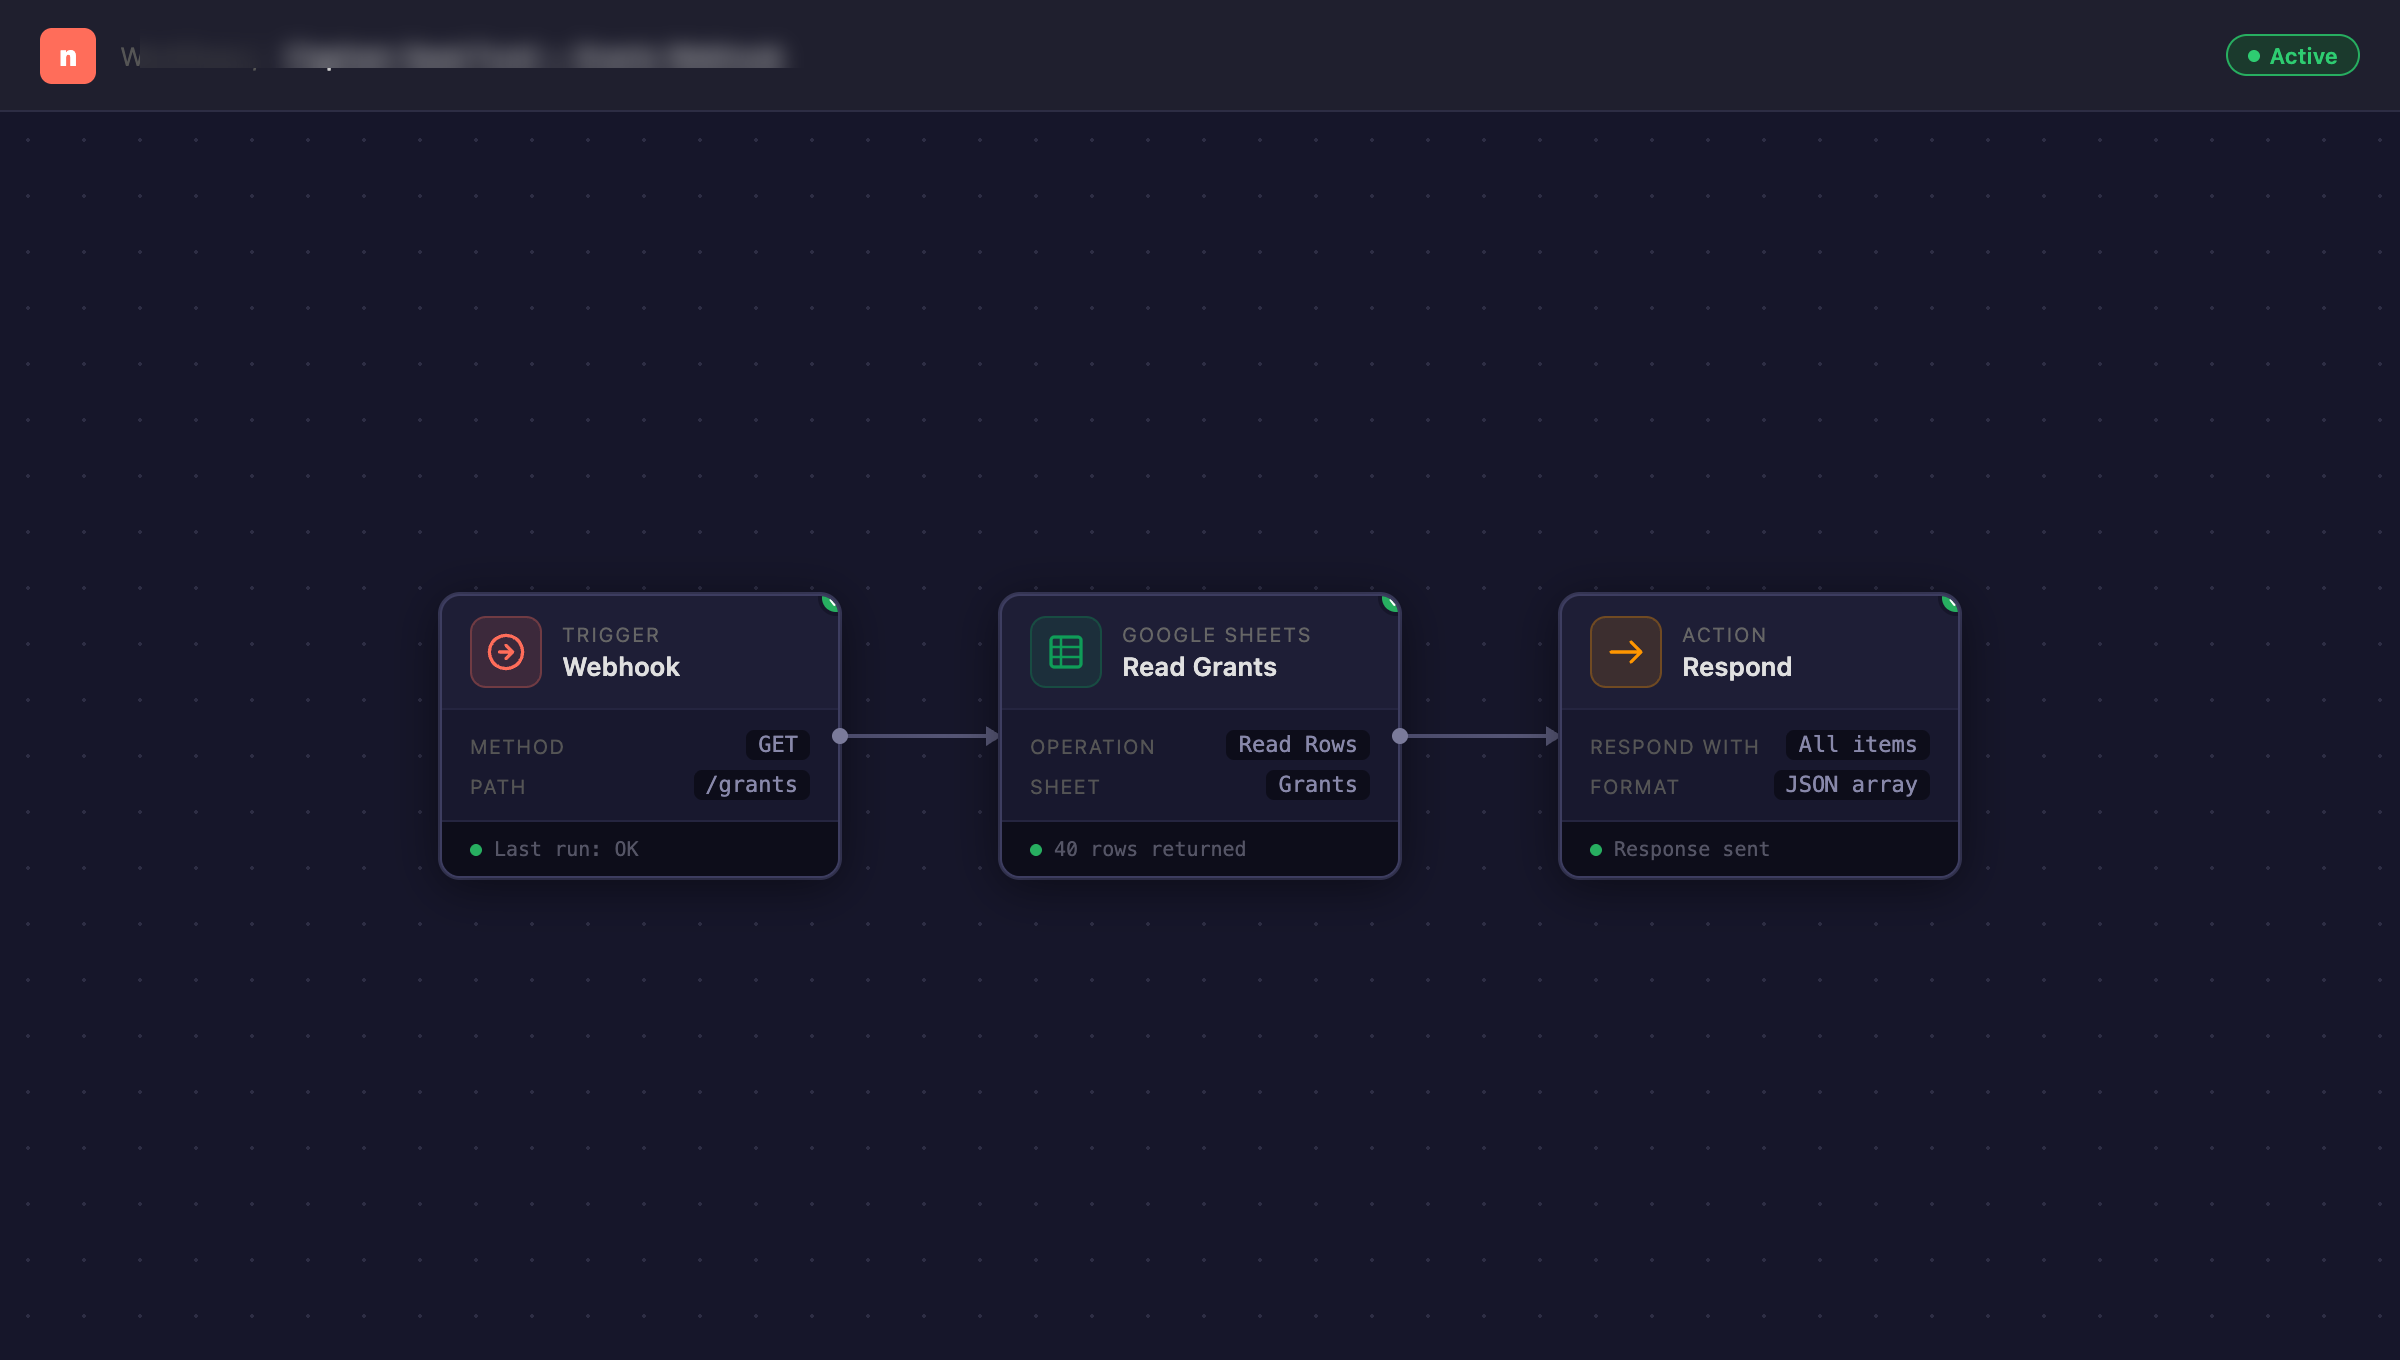
The dashboard never talks to Google directly. n8n sits between them — polling the Sheet on every page load, responding in under a second. The same integration pattern scales to any data source the client already uses, with no new Google Cloud credentials to manage.
Period filter

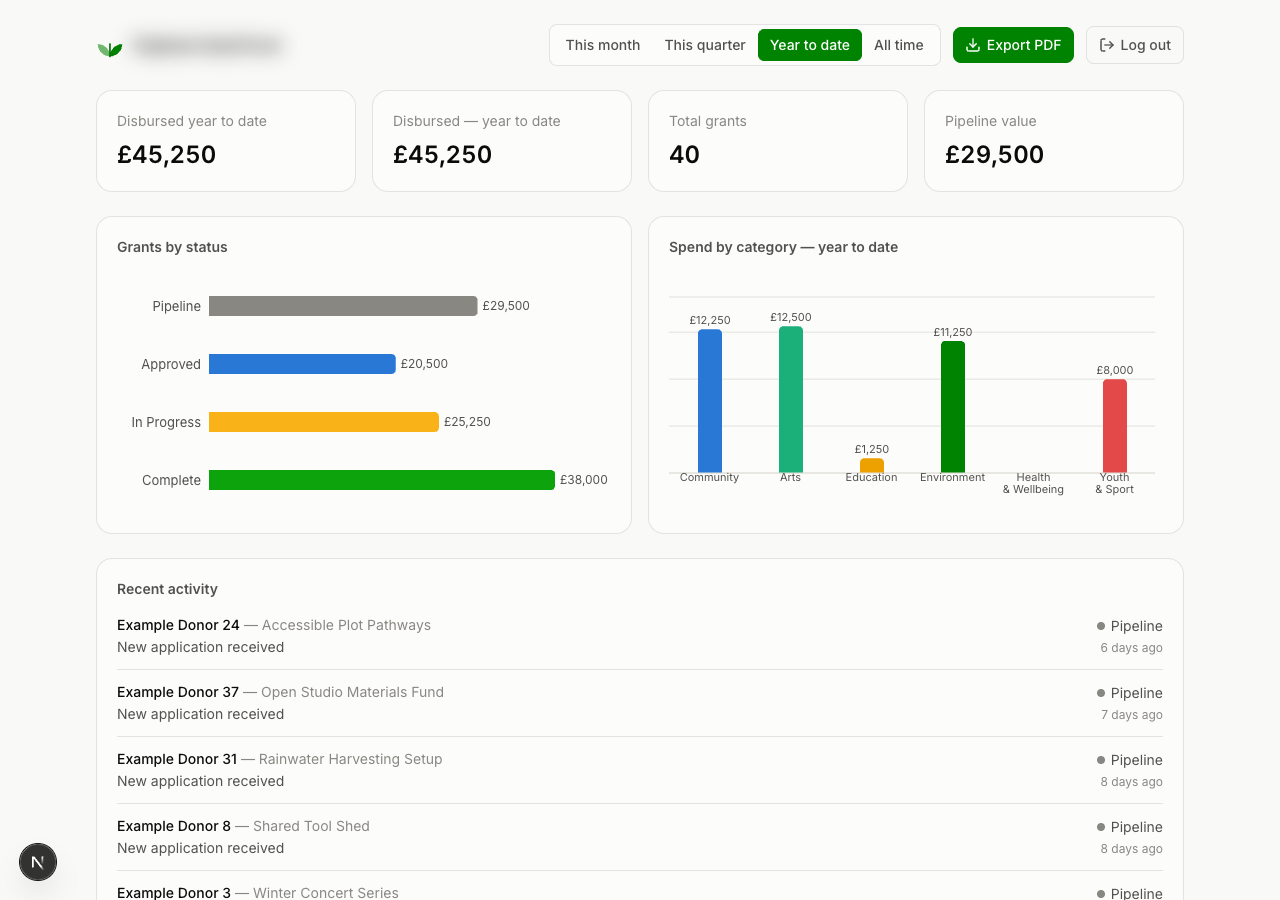
This month / This quarter / Year to date / All time. Switching the filter rescopes every KPI, every chart, and every table simultaneously — including the PDF. The direct answer to a funder asking for monthly data when the old process ran quarterly.

One-click PDF export

Generates a print-ready, branded report in the browser — KPI row, status breakdown, category spend, full grant-activity table, confidentiality footer, page numbers. Client-side, so no server to hit and no wait.

In practice

Live grants dashboard — light mode — KPIs, grants by status and spend by category
One-click PDF export — branded funder report generated from the current dashboard view
n8n automation workflow — Webhook triggers Google Sheets read and responds with live grant data
Live grants dashboard — dark mode
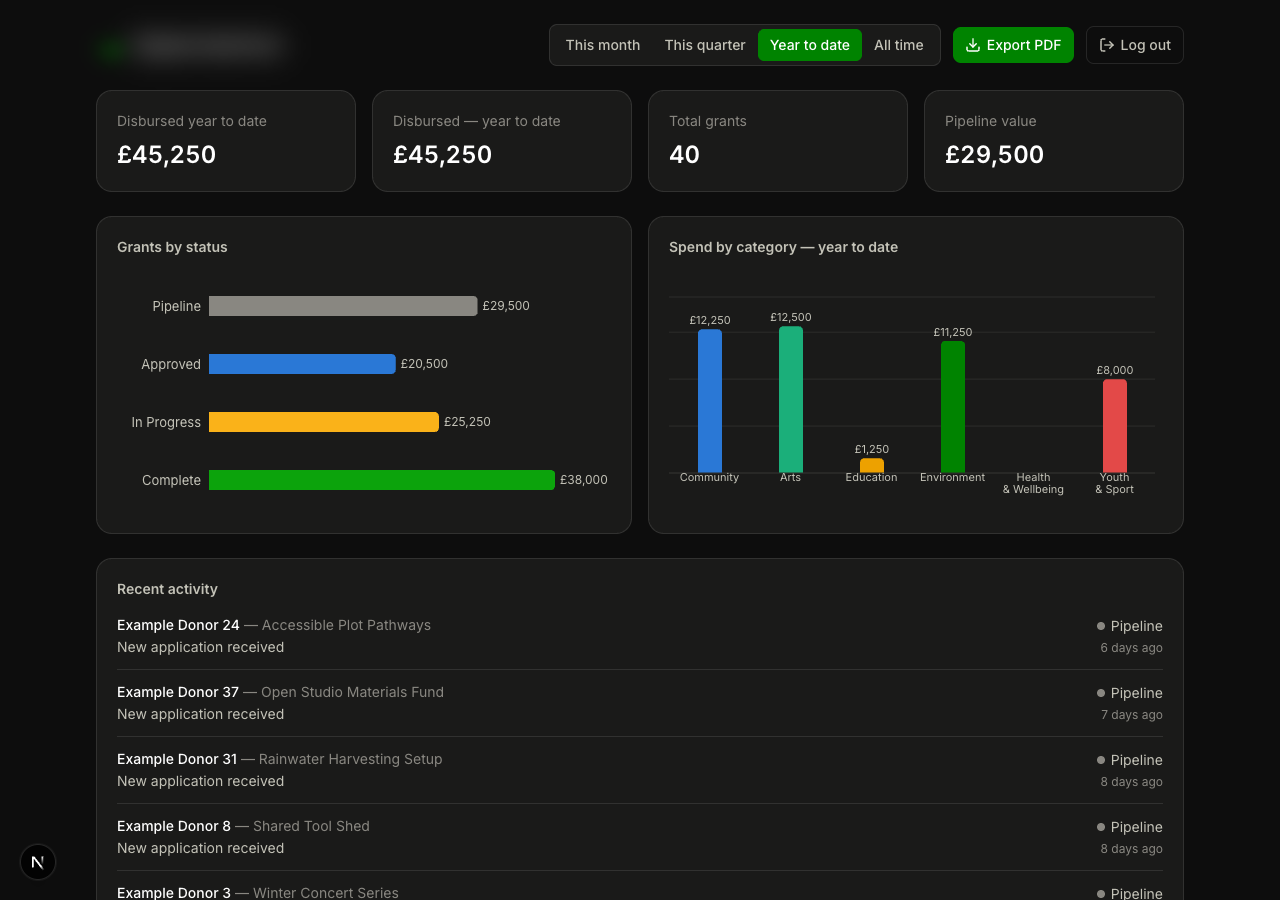
Responsive mobile layout — trustees can check live data from any device

How we solved it

The parts that actually needed thinking

01

Making the data always current without a server-side database

A dashboard that reads a Google Sheet on every page load would be slow and expensive. Instead, the Next.js server fetches from the n8n webhook and caches the response for 60 seconds — fast enough for any trustee session, fresh enough for the Finance Manager watching a data entry update propagate. If the webhook is ever unreachable, a bundled copy of the last known dataset loads instead, so the demo never breaks mid-session.

02

One set of numbers for screen and PDF

The biggest risk in a reporting tool is the screen showing one figure and the exported document showing another. Every computed metric — disbursed YTD, grants by status, spend by category — lives in a single metrics module. Both the React dashboard and the react-pdf export call the same function with the same data. The numbers cannot diverge.

03

A PDF that renders without a server

react-pdf runs entirely in the browser. No export endpoint, no lambda, no timeout risk. The client clicks Export PDF, the browser assembles the document from the current in-memory data, and the file downloads immediately. The only limit is browser memory — well within range for 40–60 grants.

04

Password gate without per-user accounts

The brief called for a single shareable link protected by one password — not a full auth system with accounts and password resets. A lightweight middleware layer checks a cookie on every request, redirects to a login page if absent, and sets it on a correct submission. Simple, auditable, and exactly as much security as the client needed for an internal reporting tool.

The Outcome

What changed after go-live

Before

  • Two full days of manual data assembly per quarterly report
  • Trustees waiting for a report to see any current figures
  • Primary funder's monthly requests impossible to fulfil at pace
  • 18-tab spreadsheet as the only source of truth — or 18 sources of error

After

  • Trustees check live data any time — no waiting for a report cycle
  • Monthly funder requests fulfilled in under a minute, any day of the month
  • Finance Manager freed from repetitive data assembly every quarter
  • One shareable link, one password, always current
2 days → 20 min
Quarterly reporting time
< 60 sec
Data pipeline latency
1-click
PDF export — any period, any time

Want this for your organisation?

If your team is still assembling reports by hand every month, we can change that. Book a free audit and we'll show you exactly what's possible.

Book a free audit

Let's get started

Tell us what's slowing you down.We'll find a way to fix it.

© 2026 Cube86. All rights reserved.

Built in London. Working globally.

Book a free call